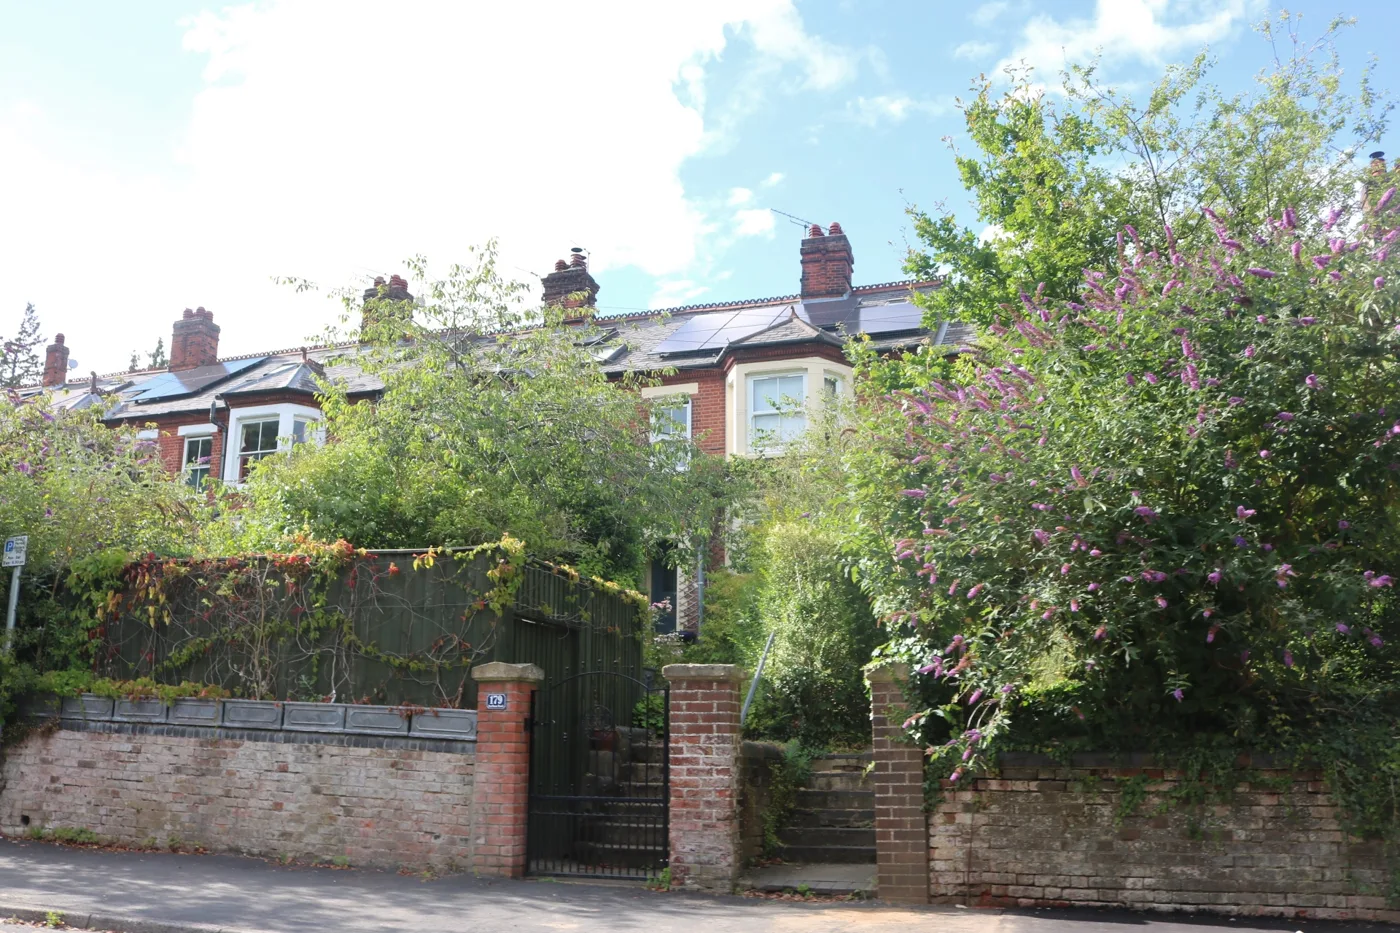

The typical Norwich home sold for £230,000 over the past year, £34,000 below the Norfolk average. Prices by ward and property type, from Land Registry sales.
Norwich is cheaper than the countryside around it. The average home in the city was £237,629 in May 2026. Across Norfolk as a whole it was £271,947, and across the East of England £338,224. A city that contains the region’s university, its teaching hospital and most of its jobs costs £34,000 less than its own county and £100,000 less than its region.
That is the single fact worth knowing about the Norwich market, and it is not a sign of a weak one. Prices here rose 5.8% over the year while Norfolk managed 3.1% and the region 2.3%. Norwich is the cheap part of an expensive region and it is closing the gap.
This page gives the official index figure, the figure from what actually sold, and then breaks the year’s sales down by property type and by city ward. Because the city council’s boundary is famously tight, we use the boundary itself rather than postcodes: not one NR postcode district lies wholly inside Norwich.
The index figure
The average home in Norwich sold for £237,629 in May 2026, up 5.8% on the £224,512 recorded a year earlier. That is the provisional figure from the UK House Price Index, built from completed HM Land Registry sales rather than asking prices and adjusted for the mix of homes sold.
By property type across the city in the same month: detached £482,569, semi-detached £305,109, terraced £260,866, flats and maisonettes £150,004. Semis rose fastest over the year at 8.0%; flats were the laggard at 2.2%.
The figure from what actually sold
Narrow it to completed sales and the number comes down. Of the 1,564 residential sales in Norwich that HM Land Registry had registered for the year to 31 July 2026 when we checked on 9 August, the median price paid was £230,000 and the mean was £258,736.
“Norwich” here means the city council’s area, not a postcode. Every NR outcode from NR1 to NR7 straddles a boundary: NR2 and NR3 are shared with Broadland, and NR1, NR4 and NR5 with both Broadland and South Norfolk. A raw NR2 figure is not a Norwich figure. We took the sales the Land Registry records in the district of Norwich and checked every postcode against the council area it actually falls in, dropping the handful that came back as Broadland, South Norfolk or, in one case, Downham Market.
The gap between that £230,000 and the index’s £237,629 is method, not disagreement. One is the plain middle of the sales; the other is mix-adjusted and pulled up by the small number of large detached houses in Eaton and along Newmarket Road.
Norwich prices by property type
| Property type | Sales | Share | Median | Mean |
|---|---|---|---|---|
| Terraced | 700 | 44.8% | £240,000 | £264,436 |
| Flats and maisonettes | 429 | 27.4% | £147,500 | £153,704 |
| Semi-detached | 266 | 17.0% | £253,750 | £303,786 |
| Detached | 169 | 10.8% | £380,000 | £430,843 |
| All types | 1,564 | 100% | £230,000 | £258,736 |
Norwich is a terraced city. Terraces are 45% of everything that sold, more than semis and detached houses put together, and their £240,000 median sits only £10,000 above the all-types figure. In most English towns the terrace is the cheap option; here it is the market.
The other number that shapes everything below is the flat. 27% of Norwich sales were flats, at a £147,500 median. A ward with a lot of flats looks cheap whether or not its houses are, and that trips people up when they compare neighbourhoods.
The ward map
Eaton is the expensive ward by a distance. Its £350,000 median is £120,000 above the city and its 67 detached sales, more than any other ward managed, came in at £447,500. Eaton and the University ward next to it are where the city’s detached housing is, and between them they took 77 of the 169 detached sales in Norwich all year.
Nelson and Town Close are the expensive terraced wards. They cover the streets between Unthank Road, Earlham Road and Newmarket Road, and a terrace there sold for £295,000 and £297,000 respectively. That is more than the city’s semi-detached median, and £75,000 to £77,000 more than a terrace in Mancroft.
The bottom of the table is a flat count, not a value
This is the trap in any Norwich neighbourhood comparison. Mancroft is the city centre ward and it comes bottom at £175,000. But 56 of its 106 sales were flats. Thorpe Hamlet comes second bottom at £186,000, and 97 of its 159 sales were flats, the highest count of any ward in the city.
| Ward | Terraced sales | Terraced median | All-types median |
|---|---|---|---|
| Town Close | 76 | £297,000 | £247,250 |
| Nelson | 104 | £295,000 | £287,500 |
| Thorpe Hamlet | 46 | £246,250 | £186,000 |
| Lakenham | 34 | £245,750 | £230,000 |
| Sewell | 111 | £230,000 | £218,000 |
| Crome | 59 | £225,000 | £229,000 |
| Mancroft | 46 | £220,000 | £175,000 |
| Mile Cross | 51 | £220,000 | £208,000 |
| Wensum | 69 | £216,000 | £216,500 |
| Catton Grove | 38 | £211,000 | £190,000 |
Read that fourth column against the third and the city looks completely different. On terraces alone the spread from top to bottom is £86,000, from Town Close at £297,000 to Catton Grove at £211,000. On all sales pooled it is £175,000. Most of the apparent gap between Norwich neighbourhoods is a difference in what kind of home comes up for sale, not in what a house is worth.
The dearest streets
Twenty-three Norwich streets recorded eight or more sales in the year, which is about the smallest number worth taking a median from. The top of that list:
- Earlham Road, 13 sales, £385,000 median
- Cambridge Street, 8 sales, £375,000
- Unthank Road, 12 sales, £326,250
- Westfield View, 9 sales, £315,000
- Lincoln Street, 8 sales, £290,000
Four of those five are in the Nelson and Town Close wards, in the grid of Victorian terraces west of the city centre; the fifth, Westfield View, is nine flats in Eaton. At the other end of the same list sit two more blocks of flats: Dalrymple Way in Catton Grove, £124,000 from 12 sales, and Scott Road in Thorpe Hamlet, £135,250 from 10. The busiest street in the city was Sprowston Road, which produced 17 sales at a £180,000 median.
Who is buying, and what renting costs
The UK House Price Index splits the city’s buyers, and every category moved at a similar pace:
- First-time buyers paid an average of £214,113 in May 2026, up 5.7% on the year.
- Former owner-occupiers paid £283,678, up 6.3%.
- Mortgage buyers averaged £237,960 and cash buyers £236,916, which is an unusually small gap.
Renting has gone the other way, and sharply. The average private rent in Norwich was £1,149 a month in June 2026, up just 1.2% from £1,136 a year earlier, while rents across the East of England rose 3.3%. Prices up 5.8% and rents up 1.2% in the same city in the same year is a wide divergence, and it means the sums on buying against renting have moved against buying over the past twelve months.
What it means for you
If you are selling, 5.8% is a good year and well ahead of both Norfolk and the region. Semis have had the best of it at 8.0%. Flats have had the worst at 2.2%, and given that flats are 27% of the Norwich market, a flat priced off 2025 comparables will sit.
If you are buying, the decision that costs real money here is property type, not neighbourhood. A terrace in the cheapest ward and a terrace in the dearest are £86,000 apart; a terrace and a flat in the same ward are often further apart than that. Work out which kind of home you want first, then compare wards on that type alone, because a headline ward median tells you mostly about the local flat supply.
Either way, check what is coming next door. The Greater Norwich Local Plan is being rewritten because the government says the area needs 34% more homes than it is planning for, and the council’s own 1,100-home Anglia Square scheme is mid-demolition; our planning page sets out where that stands. And if you are buying to commute, the train to London is 1 hour 39 minutes at its fastest and £10,716 a year on a season ticket, which is a large part of why Norwich prices behave the way they do.
Frequently asked questions
What is the average house price in Norwich?
£237,629 in May 2026 on the UK House Price Index, up 5.8% on the year. The median price actually paid across 1,564 sales registered in the year to 31 July 2026 was £230,000.
Are house prices in Norwich going up?
Yes, and faster than the county or the region. Norwich rose 5.8% in the year to May 2026, against 3.1% for Norfolk and 2.3% for the East of England.
Why is Norwich cheaper than the rest of Norfolk?
The city average is £237,629 against £271,947 for Norfolk. The city’s housing stock is mostly terraces and flats, which together were 72% of everything sold in the past year, while the county’s is far more heavily detached. Norfolk’s detached average is £393,525.
What is the cheapest part of Norwich to buy in?
On all sales pooled, Mancroft at a £175,000 median, then Thorpe Hamlet at £186,000. Both figures are held down by flats. On terraced houses alone the cheapest wards are Catton Grove at £211,000 and Wensum at £216,000.
How much is a terraced house in Norwich?
The median terraced sale in the city was £240,000 over the past year, from 700 sales. Terraces are 45% of everything that sold, which makes them the default Norwich home rather than the budget option.
Where can I check what a specific house sold for?
Every completed sale in England and Wales is public. Look up a street or an address for free on HM Land Registry Price Paid, or browse the same data on Rightmove and Zoopla.
Sources
- UK House Price Index, Norwich (ONS and HM Land Registry) for the city average, annual change, property-type and buyer-type figures, the private rent figure and the Norfolk, East of England and England comparisons. Prices May 2026 provisional, rents June 2026, page last updated 22 July 2026.
- HM Land Registry Price Paid Linked Data queried on 9 August 2026 for every residential sale the Land Registry records in the district of Norwich with a transaction date between 1 August 2025 and 31 July 2026. Each sale was checked against postcodes.io for its council area and ward before the medians, means and counts here were calculated, so only sales inside the city are included.
- HM Land Registry Price Paid search to check any individual address.
Land Registry data is added to as sales are registered, so figures for the most recent months rise as more transactions come in. Medians are of registered sales, not of every home in an area, and a ward or street with only a handful of sales moves a long way on one large house.
Have your say