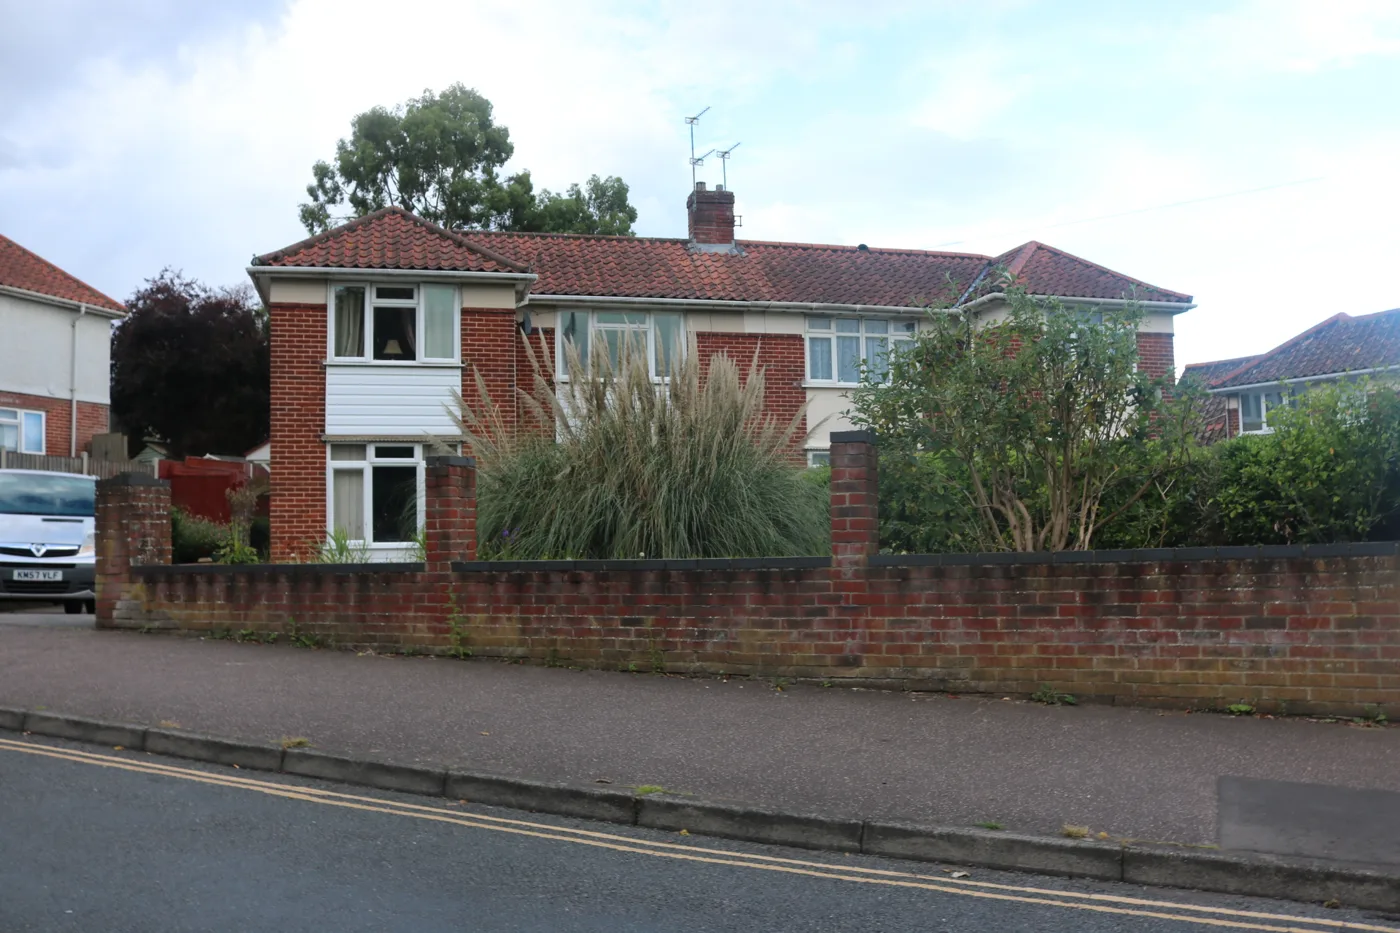

The average Norwich home is worth £5,243 less than a year ago. Only North Norfolk fell faster in the county, and flats took the worst of it, down 5.2%.
The average Norwich home sold for £224,323 in July, £5,243 less than a year earlier, according to the latest UK House Price Index from HM Land Registry.
That is a fall of 2.3 per cent over twelve months, against a rise of 1.1 per cent across England. Norwich is one of only two Norfolk districts where prices are lower than they were a year ago.
The month itself was worse than the year. Prices fell 2.2 per cent between June and July, the 13th steepest monthly drop of the 295 English districts. On the annual figure Norwich ranks 33rd steepest of those 295. Eighty-five of them fell over the year.
The annual figure has swung hard
Last month this page reported Norwich prices as 3.6 per cent up on the year. That has not simply slowed. It has reversed.
- May 2026: up 4.0 per cent on the year, average £233,538
- June 2026: up 3.0 per cent, average £229,409
- July 2026: down 2.3 per cent, average £224,323
Two things are happening at once. Prices have dropped £9,215 since May, and the Land Registry has revised the earlier months down. The June figure we reported in August was £230,706 with an annual rise of 3.6 per cent. The same month is now recorded as £229,409 and 3.0 per cent.
Revisions of that size are normal for a district as small as Norwich. In the twelve months to May 2026, the last month for which sales volumes have been published, the city recorded 1,698 residential sales, ranging from 93 in April to 204 in October. On numbers that small, one month on its own is a weak signal. This is the first negative annual reading since March.
Only North Norfolk fell faster
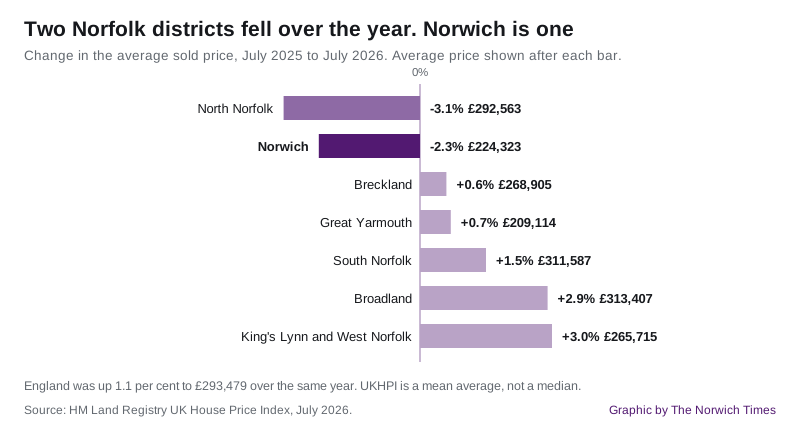
Across the county, five of the seven districts rose over the year and two fell.
- North Norfolk, £292,563, down 3.1 per cent
- Norwich, £224,323, down 2.3 per cent
- Breckland, £268,905, up 0.6 per cent
- Great Yarmouth, £209,114, up 0.7 per cent
- South Norfolk, £311,587, up 1.5 per cent
- Broadland, £313,407, up 2.9 per cent
- King’s Lynn and West Norfolk, £265,715, up 3.0 per cent
England as a whole was up 1.1 per cent to £293,479, and the East of England up 0.5 per cent to £337,518.
Norwich remains the second cheapest place to buy in Norfolk, after Great Yarmouth. The gap with the district that wraps around the city has widened: Broadland now averages £313,407, which is £89,084 more than Norwich.
Flats did the damage
The city average is dragged down by one property type.
| Type | Average, July 2026 | Change on the year |
|---|---|---|
| Detached | £455,015 | down 1.8% |
| Semi-detached | £287,637 | down 0.8% |
| Terraced | £246,876 | down 1.0% |
| Flat or maisonette | £141,187 | down 5.2% |
A 5.2 per cent fall in flats is the 27th steepest of 295 English districts. England’s flats fell 3.5 per cent over the same year and the East of England’s fell 2.5 per cent, so this is a sharper version of a national pattern rather than something peculiar to Norwich.
It matters more here than in most places. Norwich is a city of conversions, purpose-built blocks and student-adjacent flats, and flats are what a first-time buyer in the city can usually afford. The index puts the first-time buyer average at £202,230, down from £206,881 a year ago.
What it means for you
- If you are buying, the city has got cheaper in cash terms for the first time since March. A flat has got cheaper faster than anything else.
- If you are selling, the asking prices of a year ago are no longer a guide. Detached homes held their value best in percentage terms, but they also lost the most in pounds: £8,134 off the average detached house.
- If you are remortgaging, a valuation may come in below what you expected, which can push you into a worse loan-to-value band.
- Do not read one month as a trend. Norwich’s annual rate has been between minus 5.2 per cent and plus 4.0 per cent in the past twelve months.
Two cautions on the figures themselves. The UK House Price Index is a mean average, not a median, so a handful of expensive sales move it. And the sales volumes behind June and July have not been published yet, which is one reason those two months are the most likely to be revised.
Our Norwich house prices page has the longer picture, including how the city compares with its neighbours and what sold recently.
Sources
- UK House Price Index, HM Land Registry, Norwich, July 2026 for the £224,323 average, the 2.3 per cent annual fall, the 2.2 per cent monthly fall, the figures by property type, the first-time buyer average and the monthly series back to 2023 used for the swing and the range.
- UK House Price Index full file for July 2026, downloaded on 21 September 2026, for the comparison of all 295 English districts. It is the source for Norwich being 13th steepest on the month, 33rd steepest on the year and 27th steepest on flats, and for the England, East of England and Norfolk district figures.
- Our own report of the June 2026 release, Norwich house prices fall £3,729 in a month to £230,706, for the figures as they were first published, which the Land Registry has since revised.
Have your say