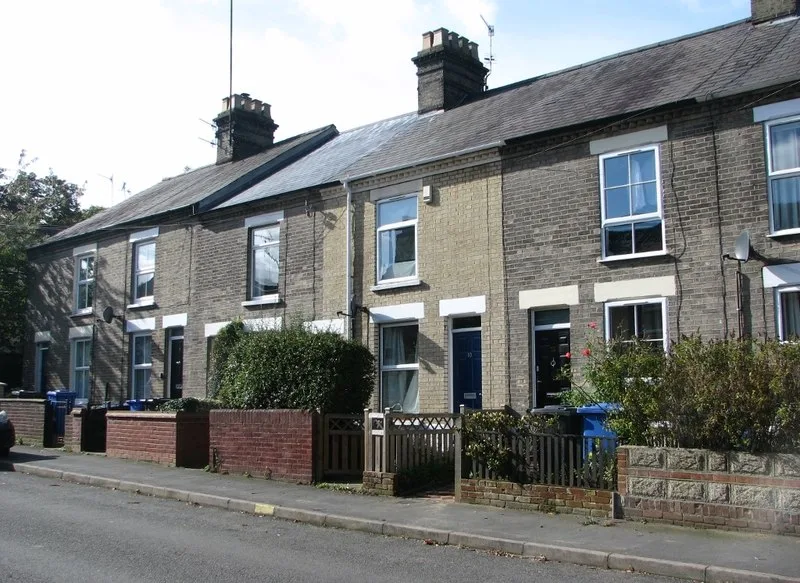

Norwich's average home reached £237,629 in May, the fastest annual rise since March 2023 and second only to Broadland in Norfolk. It is still below January 2023.
The average Norwich home was worth £237,629 in May, up £13,117 on the same month a year earlier, according to the latest UK House Price Index from HM Land Registry. That is a rise of 5.8 per cent, and it is the fastest annual growth the city has recorded since March 2023.
It also marks a genuine turn. Norwich prices had been falling on this measure for most of the previous three years. The annual change was negative in every month from April 2023 to March 2026 bar one, August 2025, when it crept up 0.2 per cent. It bottomed out at minus 5.0 per cent in November 2025, when the average sat at £222,750. The index turned positive again in April 2026, at 2.7 per cent, and then jumped.
Before anyone reads that as a full recovery, one figure is worth holding on to. The index for Norwich stood at 98.2 in May, against 100.0 in January 2023, when the average price was £241,925. In other words, the typical Norwich home is still worth about £4,300 less than it was three and a half years ago, and this year’s rise has recovered ground rather than broken new.
Where Norwich sits in Norfolk
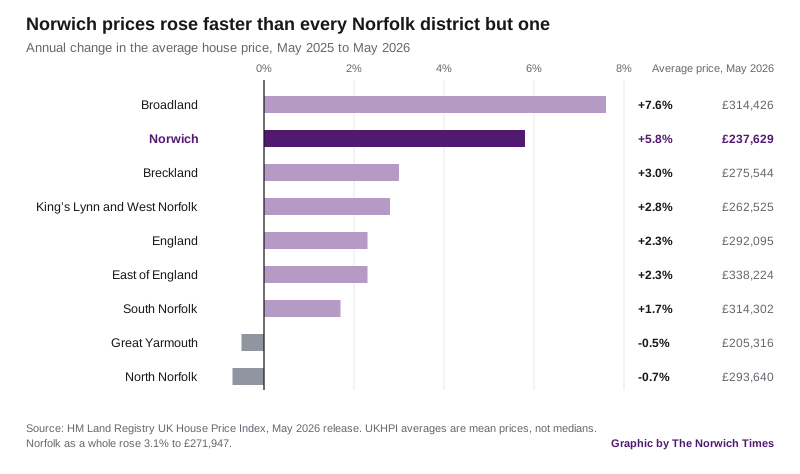
Of the seven district areas in Norfolk, only Broadland grew faster over the same year, at 7.6 per cent to £314,426. Breckland rose 3.0 per cent to £275,544, King’s Lynn and West Norfolk 2.8 per cent to £262,525, and South Norfolk 1.7 per cent to £314,302. Two districts went backwards: Great Yarmouth fell 0.5 per cent to £205,316 and North Norfolk fell 0.7 per cent to £293,640. Norfolk as a whole rose 3.1 per cent to £271,947.
Norwich also grew more than twice as fast as the national picture. England rose 2.3 per cent to £292,095 over the same twelve months, and the East of England rose 2.3 per cent to £338,224. The city remains one of the cheaper places to buy in the county: only Great Yarmouth has a lower average, and Norwich sits £54,466 below the England figure and £100,595 below the East of England figure.
Flats are the outlier
The rise is not spread evenly across the market, and the gap matters in a city with as much flatted stock as Norwich.
Semi-detached homes rose fastest, up 8.0 per cent to £305,109. Terraced homes, the city’s most recognisable housing type, rose 7.2 per cent to £260,866. Detached homes rose 7.0 per cent to £482,569. Flats and maisonettes rose just 2.2 per cent, to £150,004, barely a quarter of the growth recorded by houses.
For anyone buying their first home, the index puts the average first-time buyer purchase in Norwich at £214,113, up 5.7 per cent on a year earlier.
What it means for you
Two things are worth knowing before you compare these figures with anything else you read.
First, UKHPI averages are mean prices, not medians. A mean is pulled upward by the small number of expensive sales at the top of the market, so it usually sits above the price a typical buyer actually pays. Our own Norwich house prices page, built from individual Land Registry sale records rather than the index, puts the median city sale at £230,000, and breaks it down ward by ward. The two numbers are not in conflict; they are measuring different things.
Second, the index runs behind the market. May 2026 is the most recent month published, so these figures describe completions from a period when buyers were agreeing prices earlier still. Land Registry revises the index as more sales are registered, so the May figure may move.
If you are following the supply side of this, Greater Norwich’s housing requirement rose to 2,590 homes a year against 4.85 years of identified land, set out on our Norwich planning page.
Have your say