
The average Norwich home sold for £227,535 in August, £4,671 less than a year ago. Rents rose £9 a month, one of the slowest rises in England.
The average Norwich home sold for £227,535 in August, £4,671 less than a year earlier. That is a fall of 2.0 per cent, according to the UK House Price Index published by HM Land Registry on 21 October.
It is the second month running that Norwich prices have been lower than a year before. England as a whole rose 0.4 per cent over the same twelve months, to £293,525.
Renters got a better deal still. The Office for National Statistics puts the average Norwich rent at £1,148 a month in September, up £9 on a year earlier. Twelve months ago rents in the city were rising by 8.7 per cent a year.
A small rise on the month
Prices did pick up between July and August, by 0.8 per cent or £1,907. One month is a weak signal in a district this size, and the July figure has itself moved.
- July as first published (September): £224,323, down 2.3 per cent on a year
- July as revised (October): £225,628, down 1.7 per cent
- August, first estimate: £227,535, down 2.0 per cent
The Land Registry revises recent months as late sales are registered. In the twelve months to June 2026, the last month with published volumes, Norwich recorded 1,754 sales. That is roughly 150 a month, so a few expensive or cheap sales shift the average. Our July report now carries a note on the revision.
The city is still well below its high point. The index peaked at £242,144 in December 2022. August’s average is £14,609, or 6.0 per cent, below that.
Second steepest fall in Norfolk
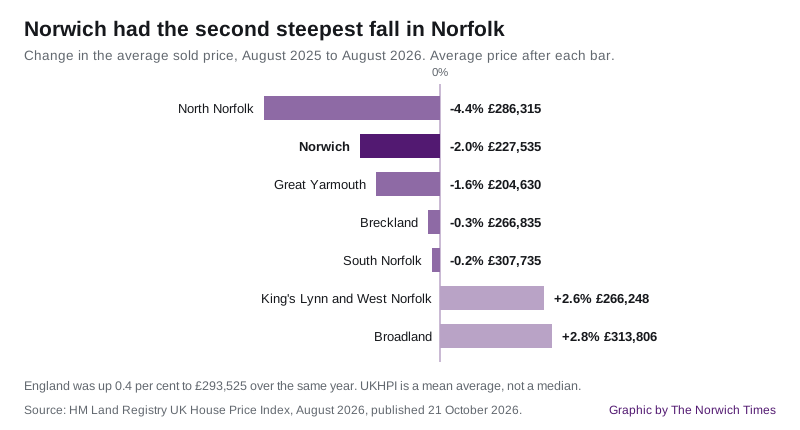
Five of Norfolk’s seven districts were down on the year. Only North Norfolk fell faster than the city.
- North Norfolk, £286,315, down 4.4 per cent
- Norwich, £227,535, down 2.0 per cent
- Great Yarmouth, £204,630, down 1.6 per cent
- Breckland, £266,835, down 0.3 per cent
- South Norfolk, £307,735, down 0.2 per cent
- King’s Lynn and West Norfolk, £266,248, up 2.6 per cent
- Broadland, £313,806, up 2.8 per cent
Norfolk as a whole was down 0.2 per cent to £267,745. Across England’s 295 districts, 107 fell over the year, and Norwich had the 42nd steepest fall.
Broadland, which wraps around the city, now averages £86,271 more than Norwich.
Ipswich is almost level
A year ago the average Norwich home cost £11,396 more than one in Ipswich. In August the gap was £1,360.
| August 2025 | August 2026 | Change | |
|---|---|---|---|
| Norwich | £232,206 | £227,535 | down 2.0% |
| Ipswich | £220,810 | £226,175 | up 2.4% |
Ipswich prices rose 2.0 per cent in August alone, while Norwich rose 0.8 per cent. Ipswich, about 40 miles south, has been the cheaper of the two in 116 of the 128 months since January 2016. It was last the dearer in April 2025.
Flats fell hardest again
| Type | Average, August 2026 | A year earlier | Change |
|---|---|---|---|
| Detached | £460,728 | £467,823 | down 1.5% |
| Semi-detached | £291,175 | £293,671 | down 0.8% |
| Terraced | £250,591 | £252,533 | down 0.8% |
| Flat or maisonette | £143,295 | £150,382 | down 4.7% |
Flats lost £7,087 on the year, almost exactly what detached houses lost in pounds (£7,095) from an average price three times lower. The 4.7 per cent fall is the 36th steepest for flats among England’s 295 districts. Flats fell 2.9 per cent across England and 1.3 per cent across the East of England.
The first-time buyer average was £205,202, down 1.9 per cent from £209,262.
Rents have stopped climbing
The ONS private rent figures, published the same day, show how sharply the rental market in the city has cooled.
- September 2025: £1,139 a month, up 8.7 per cent on a year
- March 2026: £1,146, up 2.4 per cent
- September 2026: £1,148, up 0.8 per cent
Of 294 English council areas, only 16 had slower rent growth than Norwich in September. Rents rose 4.0 per cent across England, to £1,466, and 3.8 per cent across the East of England.
Norwich is still the dearest place to rent in Norfolk by some distance.
- Norwich, £1,148, up 0.8 per cent
- South Norfolk, £984, up 3.3 per cent
- Broadland, £941, up 4.1 per cent
- Breckland, £935, up 4.6 per cent
- North Norfolk, £865, up 4.0 per cent
- Great Yarmouth, £841, up 7.1 per cent
By size, a one-bedroom home in the city averaged £781 a month, a two-bedroom £976 and a three-bedroom £1,144. All three were up between 0.9 and 1.3 per cent.
What it means for you
- If you are buying, the average Norwich home is cheaper than a year ago, and a flat is about £7,000 cheaper. The August rise is too small and too new to call a turn.
- If you are selling, a year-old valuation is likely to be too high. Compare with recent sales on your street rather than the index.
- If you rent, your landlord has less room to push through a big rise than at any time in the past year. The city average went up £9 a month in twelve months.
- If you are remortgaging a flat, check your loan-to-value before you apply. A lower valuation can push you into a dearer rate band.
The UK House Price Index is a mean average, not a median, so a handful of expensive sales move it. The ONS rent figure is also an average across all lettings, not what a new tenant is quoted today.
Our Norwich house prices page has sold prices street by street and ward by ward. The next house price release, for September, is due on 18 November.
Sources
- UK House Price Index, HM Land Registry, Norwich, August 2026 for the £227,535 average, the 2.0 per cent annual fall, the figures by property type and the first-time buyer average.
- UK House Price Index full file for August 2026, downloaded on 22 October 2026, for the revised July figure, the December 2022 peak, the sales volumes, the Norfolk, Ipswich, England and East of England figures, and the rankings across 295 English districts.
- UK House Price Index for August 2026, HM Land Registry, for the release date.
- Price Index of Private Rents, UK: monthly price statistics, Office for National Statistics, 21 October 2026 edition, for every rent figure and the ranking across 294 English council areas.
Have your say